
Aquaculture Production
1.0 Export production through aquaculture:
Export oriented aquaculture production continues to increase year over the year and the increased production contributed significantly for the sea food exports from the country.
Year 2017-18 proved to be another year of scaling new peak for Export oriented Aquaculture Production, continuing the growth trend set in from 2009-10(Fig. 1). The export oriented aquaculture production, including about 13,838 MT of fish and shellfish other than shrimp, reached about 7,05,600 MT, registering a 20% increase over the previous year production. In this, contribution of shrimp was 6,91,748 MT amounting to about 98% of the export oriented production. The changes in production trends have also reflected in the exports also.
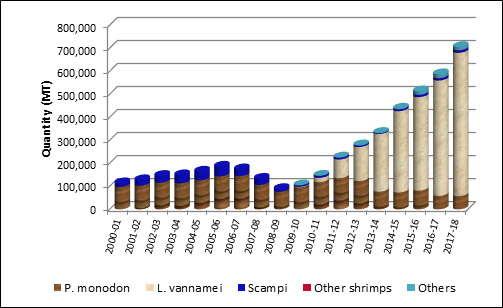
Fig. 1. Trends in progress of aquaculture production of export oriented species
The spurt in shrimp production propelled by the exponential increase in vanamei production has resulted in steep rise in shrimp exports from India, both in terms of quantity and value (Fig. 2), during the last few years. Export earnings during the year 2013-14 and 2014-15 had shown more prominent increase compared to the increase in terms of quantity. This was due to a general increase in unit value realization during the years in comparison to the previous years.

Fig. 2. Trends in progress of cultured shrimp production and shrimp exports
1.1. Shrimp aquaculture production:
Increased production of the Pacific White shrimp (Litopenaeus vannamei) continued to propel India’s cultured shrimp. The production compiled based on the reports received from the field added up to 6, 91,748 MT during 2017-18, registering an increase of 20% over the production of 5, 70,637 MT recorded during the year 2016-17. The L vannamei production during the year was 6, 22,327 MT, which was 1, 21,030 MT more than the previous year production of 5, 01,297 MT, thus registering an increase of about 24%. Figure 1 also shows that the share of L. vannamei in total shrimp production has been on the increase and, during 2017-18 it reached 89.96 % of the total shrimp aquaculture production in the country. The composition of cultured shrimp production during the year is depicted in Fig 3 below.
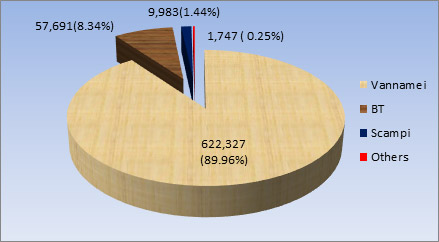
Fig. 3. Composition of shrimp species in aquaculture production 2017-18
The increase in L.vannamei production has helped to increase the overall productivity of shrimp farming. The trends in area under culture, production and productivity over the last 10 years are given in Fig. 4.
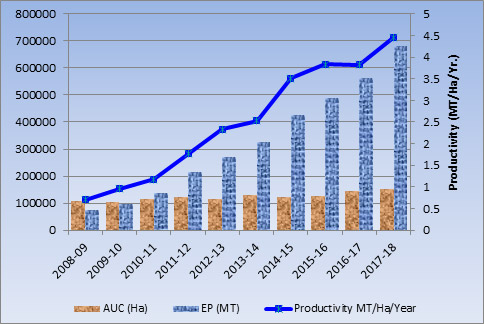
Fig. 4. Trends in progress of area under culture, production and productivity in shrimp culture
Among the other shrimps which contributed to aquaculture production during the year, the production of the native Tiger shrimp (Penaeus monodon) showed a marginal decline of 0.81 %, scampi and other shrimps (Penaeus indicus and other penaeid shrimps) registered marginal increases of 5.1 % and 4.11 % respectively from the previous years’ production
Table - 1: Variations in species-wise production in 2017-18 in comparison with 2016-17
| Sl. No | Species | Production (Quantity in MT) | % variation | ||
|---|---|---|---|---|---|
| 2017-18 | 2016-17 | Difference | |||
| 1 | L . vannamei | 6,22,327 | 5,01,297 | 1,21,030 | 24.14 |
| 2 | P. monodon | 57,691 | 58,163 | -472 | -0.81 |
| 3 | Other shrimps | 1,747 | 1,678 | 69 | 4.11 |
| 4 | Scampi | 9,983 | 9,499 | 484 | 5.10 |
1.1.1. Pacific White Shrimp
The state-wise details of area under culture and production of the species for the year 2017-18 are given in Table 2. Andhra Pradesh once again led the table with a total production of 4,56,300 MT, followed by Gujarat with a production of 55,161 MT, Tamil Nadu with 43,622 MT, Odisha with 37, 229 MT, West Bengal with 22,191 MT and others. Andhra Pradesh and Gujarat led in terms of productivity achieved during the year, while the state of Goa featured at the lowest rung.
Table - 2: State wise production of L.vannamei in 2017-18
| Sl. No. | State | Area Utilized(ha) | Production (Mt) | Productivity ( Mt/ha/year) |
|---|---|---|---|---|
| 1 | Andhra Pradesh | 62,342 | 4,56,300 | 7.32 |
| 2 | Gujarat | 7,542 | 55,161 | 7.31 |
| 3 | West Bengal | 4,127 | 22,191 | 5.38 |
| 4 | Tamil Nadu | 8,849 | 43,622 | 4.93 |
| 5 | Maharashtra | 1,291 | 6,073 | 4.71 |
| 6 | Odisha | 8,862 | 37,229 | 4.20 |
| 7 | Kerala | 52 | 208 | 4.01 |
| 8 | Karnataka | 399 | 1,465 | 3.67 |
| 9 | Goa | 32 | 78 | 2.47 |
| Total | 93,496 | 6,22,327 | 6.66 |
The growth trend in area under culture and production of L vannamei in various maritime states indicated that there was continuous expansion taking place in all the states, excepting the States of Karnataka and Maharashtra. The trend in the area utilization and production of L. vannamei shrimp in various maritime states of the country is given in Table 3. During the year 2017-18 the area under culture has increased to an extent of 6,244 ha (7.2 %) from that of the previous year. Average productivity showed an increase to 6.66 MT/Ha/Yr. from the previous year’s productivity of 4.5 MT/Ha/Yr. This increase in productivity can be attributed to increase in productivity in the state of Andhra Pradesh. Farms stocking at higher rates and harvesting smaller size shrimp has resulted in higher yield per ha per annum in the state.
Table -3: State-wise area utilized and production from L vannamei farms
| State | 2013-14 | 2014-15 | 2015-16 | 2016-17 | 2017-18 | |
|---|---|---|---|---|---|---|
| W. Bengal | AUC | 130 | 326 | 1,387 | 3,657 | 4,127 |
| EP | 479 | 395 | 6,776 | 26,085 | 22,191 | |
| Orissa | AUC | 485 | 2,340 | 4,439 | 6,300 | 8,862 |
| EP | 2,907 | 11,866 | 19,241 | 25,594 | 37,229 | |
| Andhra Pradesh | AUC | 49,764 | 37,560 | 39,800 | 61,391 | 62,342 |
| EP | 2,10,639 | 2,76,077 | 2,95,332 | 3,51,137 | 4,56,300 | |
| Tamil Nadu & Pondicherry | AUC | 5,087 | 5,037 | 7,615 | 8,601 | 8,849 |
| EP | 26,281 | 32,688 | 44,453 | 48,670 | 43,622 | |
| Kerala | AUC | 0 | 6 | 22 | 31 | 52 |
| EP | 0 | 12 | 74 | 110 | 208 | |
| Karnataka | AUC | 157 | 125 | 333 | 405 | 399 |
| EP | 517 | 623 | 1,045 | 1,457 | 1,465 | |
| Goa | AUC | 29 | 27 | 10 | 2 | 32 |
| EP | 67 | 88 | 33 | 4 | 78 | |
| Maharashtra | AUC | 908 | 1,275 | 1,356 | 1,646 | 1,291 |
| EP | 3,291 | 4,901 | 6,118 | 6,831 | 6,073 | |
| Gujarat | AUC | 707 | 3,545 | 4,154 | 5,219 | 7,542 |
| EP | 6,326 | 26,763 | 32,946 | 41,409 | 55,161 | |
| Total | AUC | 57,267 | 50,240 | 59,116 | 87,252 | 93,496 |
| EP | 2,50,507 | 3,53,413 | 4,06,018 | 5,01,297 | 6,22,327 |
AUC: Area Under Culture
EP: Estimated Production
Table below provides a comparison of the estimates of the product weight generated from the culture production and the estimated value of the produce for 2016-17 and 2017-18. There is a 24.14 % increase in live weight and product weight and about 31.75 % increase in value realization.
Table – 4: L vannamei Production through Aquaculture in 2016-17and 2017-18
| Year | Live weight (MT) | Product weight (MT) | Estimated Value (Rs in Crore) |
|---|---|---|---|
| 2016-2017 | 5,01,297 | 3,25,843 | 18,899.00 |
| 2017-2018 | 6,22,327 | 4,04,500 | 24,900.00 |
| Increase/ Decrease | (+) 1,21,030 | (+) 78,657 | (+) 6,001 |
| Difference % | (+) 24.14% | (+) 24.14% | (+) 31.75 % |
Tiger Shrimp
The tiger shrimp production reported during the year was 57,691 MT. The state West Bengal contributed about 85.49 % (49,319 MT) of the total tiger shrimp production of the country, followed by Odisha (5.87 %), Andhra Pradesh (4.70 %), Kerala (2.64%) ,Gujarat Karnataka and Tamil Nadu contributed the rest 1.30%. The state wise details of area utilized for culture and production during the year 2017-18 is given in table 5.
Table – 5: State wise production details of Tiger shrimp in 2017- 18
| Sl. No. | State | Area (Ha) | Production (MT) | Productivity MT/ha/yr. |
|---|---|---|---|---|
| 1 | West Bengal | 51,084 | 49,319 | 0.97 |
| 2 | Orissa | 2,624 | 3,887 | 1.48 |
| 3 | Andhra Pradesh | 1,880 | 2,714 | 1.44 |
| 4 | Kerala | 3,144 | 1,522 | 0.48 |
| 5 | Gujarat | 55 | 162 | 2.97 |
| 6 | Karnataka | 302 | 59 | 0.19 |
| 7 | Tamil Nadu | 10 | 28 | 2.80 |
| 8 | Goa | 0 | 0 | 0.00 |
| 9 | Maharashtra | 0 | 0 | 0.00 |
| Total | 59,099 | 57,691 | 0.98 |
In comparison with the production of Tiger shrimp in the year 2016-17, the production decreased marginally by about 0.81 % during the current year. The trends in area utilization and state-wise production points towards a progressive decline over the years (Table 6). However, the productivity has been steady at about 1 MT/Ha/Yr.
Table -6. State-wise area utilized and production from Tiger shrimp farms
| State | 2013-14 | 2014-15 | 2015-16 | 2016-17 | 2017-18 | |
|---|---|---|---|---|---|---|
| W. Bengal | AUC | 48,730 | 48,848 | 50,593 | 48,474 | 51,084 |
| EP | 53,049 | 53,526 | 61,998 | 44,966 | 49,319 | |
| Orissa | AUC | 5,523 | 5,392 | 4,552 | 2,273 | 2,624 |
| EP | 11,075 | 10,075 | 9,191 | 3,699 | 3,887 | |
| Andhra Pradesh | AUC | 2,522 | 2,190 | 2,637 | 2,835 | 1,880 |
| EP | 2,883 | 2,962 | 3,739 | 4,819 | 2,714 | |
| Tamil Nadu Pondicherry | AUC | 343 | 38 | 409 | 150 | 10 |
| EP | 916 | 73 | 1,103 | 384 | 28 | |
| Kerala | AUC | 12,719 | 13,230 | 8,306 | 3,929 | 3,144 |
| EP | 3,360 | 3643 | 3,490 | 2,297 | 1,522 | |
| Karnataka | AUC | 94 | 689 | 1,948 | 735 | 302 |
| EP | 56 | 499 | 682 | 635 | 59 | |
| Goa | AUC | 53 | 7 | 0 | 12 | 0 |
| EP | 14 | 16 | 0 | 6 | 0 | |
| Maharashtra | AUC | 817 | 126 | 3 | 6 | 0 |
| EP | 1,083 | 177 | 6 | 11 | 0 | |
| Gujarat | AUC | 1,375 | 881 | 398 | 437 | 55 |
| EP | 4,362 | 2,184 | 1,243 | 1,346 | 162 | |
| Total | AUC | 72,177 | 71,400 | 68,846 | 58,851 | 59,099 |
| EP | 76,798 | 73,156 | 81,452 | 58,163 | 57,691 |
AUC: Area Under Culture
EP: Estimated Production
Table 7 gives a comparison of the tiger shrimp production, estimated product weight generated from the production and the estimated value of the production for the years 2016-17and 2017-18. The percentage decline in live weight and product weight was about 0.81 and 0.84 % respectively and the decline in value realization was about 0.65%. The unit value realization for Tiger shrimp appears to have increased compared to the previous year.
Table – 7: Comparison of cultured Tiger shrimp production in 2016-17and 2017-18
| Year | Live weight (MT) | Product weight (MT) | Estimated Value (Rs. Crore) |
|---|---|---|---|
| 2016-17 | 58,163 | 34,892 | 2,617.00 |
| 2017-18 | 57,691 | 34,600 | 2,600.00 |
| Increase/Decrease | (-) 472 | (-) 292 | (-)17.00 |
| Difference % | (-) 0.81% | (-) 0.84% | (-) 0.65% |
1.1.3 Scampi
As per the reports received from the field offices, the total Scampi production during the year under report was 9,983 MT, registering a marginal increase of about 5.1% compared to the previous year’s production of 9,499 MT. Table – 8 provides the production of scampi details of all maritime states. West Bengal remains to be the major producer of Scampi from monoculture farms.
Table – 8: State wise production details of Scampi in 2017-18
| Sl. No. | State | Production (MT) |
|---|---|---|
| 1 | West Bengal | 5,024 |
| 2 | Orissa | 1,619 |
| 3 | Andhra Pradesh | 167 |
| 4 | Tamil Nadu | 90 |
| 5 | Kerala | 0 |
| 6 | Karnataka | 0 |
| 7 | Goa | 0 |
| 8 | Maharashtra | 1,463 |
| 9 | Gujarat | 1,620 |
| Total | 9,983 |
Table 9 provides a comparison of live weight and estimated product weight from the production and estimated value during 2016-17and 2017-18. While there is a marginal decline in the live weight and product weights there was a marginal increase in the value realization.
Table – 9: Comparison of cultured Scampi Production in 2016-17and 2017-18
| Year | Live Weight (MT) | Product Weight (MT) | Estimated Value (Rs. Crore) |
|---|---|---|---|
| 2016-17 | 9,499 | 4,750 | 375.00 |
| 2017-18 | 9,983 | 4,990 | 400.00 |
| Increase/Decrease | (+)484 | (+)240 | (+) 18.00 |
| Difference in % | (+) 5.10% | (+) 5.10% | (+) 6.67% |
1.2. Contribution of Cultured Shrimp and Scampi for export
The total export oriented shrimp aquaculture production during 2017-18 showed an impressive increase by about 121111 MT to reach a total production of 6,91,748 MT worth an estimated value of Rs. 27,900 Crore . Table 10 gives a comparison of the estimated product weight and value of shrimp and scampi that contributed to the shrimp exports of the country during 2017-18 vis-à-vis 2016-17.
The production and product weight generated from the total shrimp and scampi production registered an increase of about 21.22 % and 21.51 % respectively while the estimated value of the produce registered an increase of 27.45 % in comparison to that of the previous year.
Table – 10: Comparison of total Shrimp & Scampi Production from aquaculture in 2016-17and 2017-18
| Year | Live Weight (MT) | Product Weight (MT) | Estimated Value (Rs Crore) |
|---|---|---|---|
| 2016-17 | 5,70,637 | 3,65,486 | 21,891.00 |
| 2017-18 | 6,91,748 | 4,44,090 | 27,900.00 |
| Increase/Decrease | (+) 121111 | (+) 78604 | (+) 6,009.00 |
| Difference in % | (+) 21.22% | (+) 21.51 % | (+) 27.45 % |
Figures 5 & 6 provides the trends in the contribution of cultured shrimps, in terms of quantity and value, to shrimp exports of the country during the last 10 years. It clearly illustrates how the arrival of L. vannamei culture has positively impacted the growth in shrimp exports of the country both in terms of quantity and value.
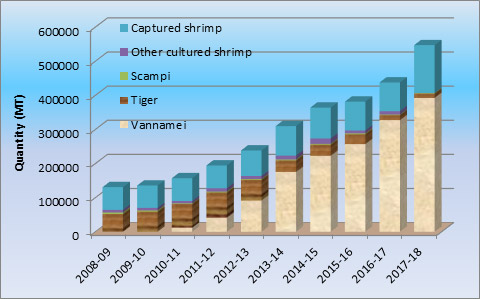
Fig. 5 Progress in export of shrimp during the last 10 years

Fig. 6. Influence of L vannamei in foreign exchange earnings from export of shrimp during last 10 years.
1.3. Production of Other exportable varieties of fish and shellfish.
The field offices reported production of 13,615 MT of other diversified species, such as Crab, Sea bass, and Tilapia (GIFT) besides Pangassius production of about 26,300 MT of during the year under report. The production of diversified species of fish and shellfish for export is still in the early stages. Large scale development can be possible with the involvement of corporate bodies who can invest in setting up integrated units of exportable varieties of fish and shellfish including hatcheries, farms and processing plants. Details of production of diversified export oriented species are given in the table below:
Table - 11: State-wise culture production of new exportable species during 2017-18
| Sl. No | State | Crab | Seabass | Tilapia | Pangassius | ||||
|---|---|---|---|---|---|---|---|---|---|
| Area (Ha) | Quantity (MT) | Area (Ha) | Quantity (MT) | Area (Ha) | Quantity (MT) | Area (Ha) | Quantity (MT) | ||
| 1 | West Bengal | 4,324 | 270 | 15,046 | 2,214 | 4,346 | 1,200 | 346 | 513 |
| 2 | Orissa | 804 | 503 | 148 | 116 | 202 | 103 | 26 | 14 |
| 3 | Andhra Pradesh | 2,181 | 1,052 | 379 | 585 | 0 | 0 | 3,316 | 24,845 |
| 4 | Tamil Nadu | 48 | 24 | 26 | 24 | 30 | 40 | 0 | 0 |
| 5 | Kerala | 47 | 11 | 6 | 3 | 203 | 229 | 175 | 225 |
| 6 | Karnataka | 90 | 46 | 0 | 11 | 0 | 6 | 0 | 10 |
| 7 | Goa | 0 | 0 | 0 | 0 | 0 | 6 | 0 | 0 |
| 8 | Maharashtra | 0 | 220 | 0 | 1,287 | 0 | 5,601 | 0 | 573 |
| 9 | Gujarat | 0 | 0 | 0 | 0 | 6 | 70 | 0 | 113 |
| Total | 7,494 | 2,126 | 15,605 | 4,240 | 4,787 | 7,249 | 3,863 | 26,293 | |