Exports
EXPORT PERFORMANCE 2017- 2018
The Marine Products Export Development Authority (MPEDA) is a statutory body under the Ministry of Commerce & Industry, Govt. of India. MPEDA is the nodal agency for promotion of export of marine products from India. MPEDA has presence in all the maritime states and is implementing its developmental schemes for export promotion and aquaculture production through its field offices.
During the financial year 2017-18, India has exported 13, 77,244 MT of seafood worth US$ 7.08 billion. USA and South East Asia continued to be the major import markets of Indian seafood as in the previous year. Frozen Shrimp remained the major export item followed by frozen fish.
Export summary reports are given in the Table.1
| Marine products export performance during 2017 - 2018 compared to 2016 - 2017 | |||
|---|---|---|---|
| Export Details | 2017-18 | 2016-17 | Growth % |
| Quantity in Tons | 13,77,244 | 11,34,948 | 21.35 |
| Value in Crores | 45,106.89 | 37,870.90 | 19.11 |
| USD in Million | 7,081.55 | 5,777.61 | 22.57 |
| Unit Value (USD/Kg) | 5.14 | 5.09 | 1.01 |
The average unit value realization of overall exports has rose to US$ 5.14 per Kg in the period under review against US$ 5.09 in the same period last year. However the unit value realization of Fr. Shrimp has shown a decline of US$ 0.01 per Kg compared to last year. (Shrimp constituted 68.46% value of total exports).
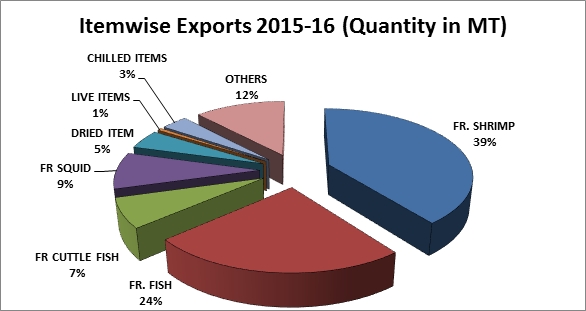
MAJOR ITEM WISE EXPORTS DETAILS
Frozen shrimp continued to be the major item of export in terms of quantity and value, accounting for a share of 41.10 % in quantity and 68.46% of the total USD earnings. Shrimp exports during the year rose by 30.26% in quantity and 30.10% in USD value.
The overall export of shrimp during 2017-18 was 5, 65,980 MT worth USD 4,848.19 Million. USA is the largest market (2, 25,946 MT) for frozen shrimp followed by South East Asia (1, 59,145 MT), European Union (78,426 MT), Japan (33,828 MT), Middle East countries (23,441 MT), China (13,107 MT) besides others (32,087 MT).
The export of Vannamei shrimp has improved from 3, 29,766 MT to 4,02,374 MT in 2017-18 with a growth of 22.02% in quantity and 24.74% in USD value. About 52.84 % of total Vannamei shrimp exported was to USA, followed by 21.03% to South East Asian countries, 11.31% to EU, 4.67% to Japan, 3.00% to Middle East, 1.35% to China and 5.80% to Other Countries. Japan is the major market for Black Tiger shrimp with a share of 43.18% in terms of value followed by USA (20.07%) and South East Asia (17.38%) in USD.
Frozen Fish is the second largest export item, accounting to 25.64% in quantity and 10.35% in USD earnings. Export of Frozen fish showed a positive growth of 9.03% in USD terms. However, the unit value realization decreased by 8.39% to 2.08 USD/Kg in 2017-18 from 2.27 USD/Kg in 2016-17.
Frozen squid exports grew by 1.51% in quantity, but declined by 4.79%, and 0.93% in rupee value and USD earnings respectively. Unit value realization also dropped by 2.40%. Export of chilled items has showed a decline of 38.71%, 15.90% and 12.27% in quantity, rupee value and USD earnings respectively.
Export of Chilled items also improved in terms of quantity as well as in value, with a growth of 5.56%, 27.29% and 18.91% in terms of quantity, rupee value and USD earnings respectively. Unit value realization also improved by 12.65%.
Export of Frozen Cuttlefish has shown a growth in exports by 9.26% in quantity, 21.19% in rupee value and 26.35% USD. The Unit value realization also improved by remarkably 15.64%.
Dried items have shown a positive growth of 45.73% and 19.57% respectively in quantity and rupee value, but declined by 18.14% in USD terms. The unit value realized was also lower by 43.83%.
The export of Live Items rose 4.93% in quantity; however declined by 29.14% and 25.63% in rupee value and USD earnings respectively. Unit value realization also dropped by 29.12%.
Other Items have shown a positive growth of 21.97%, 30.32% and 35.58% in quantity, rupee value and USD earnings res pectively. The Unit value realization also bettered by 11.16%.
The details of major items of exports are given in the Table.2
| Table 2. Item-wise exports: 2017 - 2018 | |||||
|---|---|---|---|---|---|
| Q: Quantity in Tons, V: Value in Rs. Crores, $: USD Million, UV$:USD/Kg | |||||
| ITEM | Share % | 2017-18 | 2016-17 | Growth (%) | |
| FROZEN SHRIMP | Q: | 41.10 | 5,65,980 | 4,34,486 | 30.26 |
| V: | 68.46 | 30,868.17 | 24,711.32 | 24.92 | |
| $: | 68.46 | 4,848.19 | 3,726.38 | 30.10 | |
| UV$: | 8.57 | 8.58 | -0.12 | ||
| FROZEN FISH | Q: | 25.64 | 3,53,192 | 2,96,762 | 19.02 |
| V: | 10.36 | 4,674.03 | 4,460.90 | 4.78 | |
| $: | 10.35 | 733.17 | 672.47 | 9.03 | |
| UV$: | 2.08 | 2.27 | -8.39 | ||
| FR CUTTLE FISH | Q: | 5.02 | 69,183 | 63,320 | 9.26 |
| V: | 5.22 | 2,356.46 | 1,944.50 | 21.19 | |
| $: | 5.22 | 369.88 | 292.73 | 26.35 | |
| UV$: | 5.35 | 4.62 | 15.64 | ||
| FR SQUID | Q: | 7.32 | 1,00,845 | 99,348 | 1.51 |
| V: | 5.44 | 2,451.87 | 2,575.29 | -4.79 | |
| $: | 5.44 | 385.01 | 388.64 | -0.93 | |
| UV$: | 3.82 | 3.91 | -2.40 | ||
| DRIED ITEM | Q: | 6.46 | 88,997 | 61,071 | 45.73 |
| V: | 2.31 | 1,042.37 | 871.74 | 19.57 | |
| $: | 2.31 | 163.53 | 199.77 | -18.14 | |
| UV$: | 1.84 | 3.27 | -43.83 | ||
| LIVE ITEMS | Q: | 0.51 | 7,034 | 6,703 | 4.93 |
| V: | 0.63 | 286.11 | 403.75 | -29.14 | |
| $: | 0.64 | 45.41 | 61.05 | -25.63 | |
| UV$: | 6.46 | 9.11 | -29.12 | ||
| CHILLED ITEMS | Q: | 1.42 | 19,501 | 31,815 | -38.71 |
| V: | 1.44 | 647.41 | 769.81 | -15.90 | |
| $: | 1.44 | 101.78 | 116.02 | -12.27 | |
| UV$: | 5.22 | 3.65 | 43.13 | ||
| OTHERS | Q: | -12.27 | 1,72,512 | 1,41,442 | 21.97 |
| V: | 6.16 | 2,780.48 | 2,133.59 | 30.32 | |
| $: | 6.14 | 434.58 | 320.54 | 35.58 | |
| UV$: | 2.52 | 2.27 | 11.16 | ||
| TOTAL | Q: | 100.00 | 13,77,244 | 11,34,948 | 21.35 |
| V: | 100.00 | 45,106.89 | 37,870.90 | 19.11 | |
| $: | 100.00 | 7,081.55 | 5,777.61 | 22.57 | |
| UV$: | 5.14 | 5.09 | 1.01 | ||
Figure 2
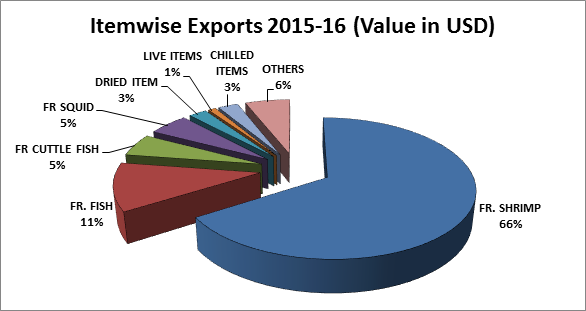
Figure 3
MARKETWISE EXPORT DETAILS
USA continued to be the major importer of Indian seafood with a share of 32.76% in terms of USD value. USA has imported 2, 47,780 MT of marine products from India during 2017-18. Export to USA has registered a growth of 31.37%, 28.63% and 33.97% in terms of quantity, rupee and USD Value respectively. Frozen shrimp continued to be the principal item of exports to USA with a share of 95.03% in USD value. Exports of Vannamei shrimp to USA showed an increase of 31.93% in quantity and 33.03% in USD terms. The Black Tiger shrimp exports to USA have decreased by 12.73% in quantity and 18.37% in USD value.
South East Asia remained the second largest market of Indian marine products accounting for a share of 31.59% in USD terms followed by European Union (15.77%), Japan (6.29%), Middle East countries (4.10%), China (3.21%) and other countries (6.28%) respectively. Overall exports to South East Asia increased by 27.20% in quantity 24.33% in rupee value and 29.45% in US $ earnings.
The major South East Asian markets for Indian marine products are Vietnam with a percentage share of 74.91% in US $ terms followed by, Thailand (10.83%), Taiwan (5.04%), Malaysia (3.37%), Singapore (3.29%), South Korea (2.31%) and Other Countries (0.25%) respectively. Among these, Vietnam alone imported 219384 MT of Indian seafood, the quantity is much more than that of any other individual markets like US, Japan or China.
European Union continued to be the third largest destination for Indian Seafood with a share of 13.82% in quantity. Frozen Shrimp continued to be the major item of export to EU accounting 41.21% in quantity and 54.05% in USD earnings. Export of frozen shrimp to EU increased by 1.62%, 1.19% and 5.38% in quantity, rupee and USD value respectively.
Japan is in fourth largest destination for Indian seafood with a share of 6.29% in USD earnings and 6.22% in quantity. Exports to Japan increased by 24.06% in quantity, 8.58% in rupee value and 12.87% in USD terms. Frozen Shrimp continued to be the major item of exports to Japan accounting a share of 39.50% in quantity and 75.08% in USD earnings out of the total exports to Japan. Exports of Frozen shrimp to Japan increased by 8.13% in quantity and 9.63% in USD value. This year BT Shrimp export to Japan has declined in quantity to 5,032 MT from 5,842 MT with a decrease of 13.87%. However, the Unit Value has increased to 13.72 USD in 2017-18 from 12.40 USD in 2016-17, with a steep increase of 10.65%. This is mainly due to the high demand propelled by lower supply of BT shrimp owing to declining production. Exports of Vannamei shrimp improved by 28.62% in quantity and 28.48% in USD value.
The export to China market showed an increase of 9.37% and 12.47% in terms of quantity and USD respectively. The rupee value has also increased 7.91%. Exports of frozen Vannamei shrimp to China have increased by 22.43%, 19.09% and 24.04% in terms of quantity, rupee value and USD respectively.
Exports to Middle East showed a positive growth in quantity, rupee value and USD value by 17.45%, 1.01% and 5.26% respectively. The exports to Other Countries showed a positive growth compared to previous year in quantity, rupee value and USD value by 19.81%, 26.18% and 9.39% respectively.
The details on major markets for Indian marine products are given in the Table. 3
| Market -wise exports: 2017 - 2018 | |||||
|---|---|---|---|---|---|
| Q: Quantity in Tons, V: Value in Rs. Crores,$: USD Million | |||||
| Market | Share % | 2017-18 | 2016-17 | Growth (%) | |
| JAPAN | 6.22 | Q: | 85,651 | 69,039 | 24.06 |
| 6.31 | V: | 2,846.30 | 2,621.37 | 8.58 | |
| 6.29 | $: | 445.27 | 394.50 | 12.87 | |
| USA | 17.99 | Q: | 2,47,780 | 1,88,617 | 31.37 |
| 32.74 | V: | 14,769.83 | 11,482.16 | 28.63 | |
| 32.76 | $: | 2,320.05 | 1,731.81 | 33.97 | |
| EUROPEAN UNION | 13.82 | Q: | 1,90,314 | 1,89,833 | 0.25 |
| 15.78 | V: | 7,115.96 | 6,892.19 | 3.25 | |
| 15.77 | $: | 1,116.74 | 1,038.59 | 7.52 | |
| CHINA | 3.61 | Q: | 49,701 | 45,443 | 9.37 |
| 3.21 | V: | 6,16,707 | 4,84,819 | 27.20 | |
| 31.59 | $: | 14,250.26 | 11,461.83 | 24.33 | |
| SOUTH EAST ASIA | 31.59 | Q: | 2,237.07 | 1,728.19 | 29.45 |
| 24.65 | V: | 7499.16 | 8620.85 | -13.01 | |
| 24.59 | $: | 1152.86 | 1416.82 | -18.63 | |
| MIDDLE EAST | 4.52 | Q: | 62,220 | 52,973 | 17.46 |
| 4.10 | V: | 1,849.10 | 1,830.58 | 1.01 | |
| 4.10 | $: | 290.46 | 275.93 | 5.26 | |
| OTHERS | 9.07 | Q: | 1,24,871 | 1,04,224 | 19.81 |
| 6.27 | V: | 2,827.40 | 2,240.83 | 26.18 | |
| 6.28 | $: | 444.57 | 406.40 | 9.39 | |
| Total | 100 | Q: | 13,77,244 | 11,34,948 | 21.35 |
| 100 | V: | 45,106.89 | 37,870.90 | 19.11 | |
| 100 | $: | 7,081.55 | 5,777.61 | 22.57 | |
Figure 4
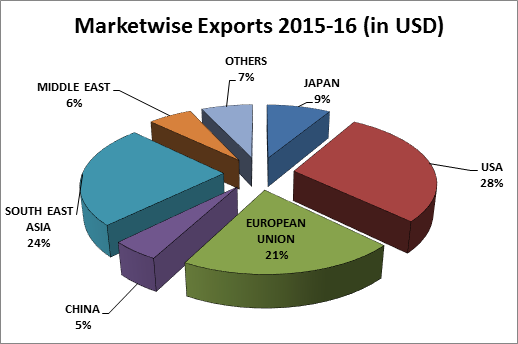
Figure 5
MAJOR PORT WISE EXPORTS
Marine products were exported through 31 different sea/air/land ports. Vizag, Kochi, Calcutta, Pipavav, Krishnapatanam and JNP are major ports handled the marine cargo. Exports improved from all the ports however the volume handled by the Culcutta has shown a slight decline. Major port-wise export details are given below..
Table 4.
| Port -wise exports: 2017 - 2018 | |||||
|---|---|---|---|---|---|
| Q: Quantity in Tons, V: Value in Rs. Crores, $: USD Million | |||||
| Ports | Share % | 2017- 18 | 2016- 17 | Growth (%) | |
| VIZAG | Q: | 14.58 | 200779 | 159973 | 25.51 |
| V: | 25.37 | 11,442.39 | 9,294.31 | 23.11 | |
| $: | 25.38 | 1,797.08 | 1,401.94 | 28.18 | |
| KOCHI | Q: | 12.79 | 176090 | 155989 | 12.89 |
| V: | 12.87 | 5,805.11 | 4,860.98 | 19.42 | |
| $: | 12.87 | 911.71 | 733.24 | 24.34 | |
| CALCUTTA | Q: | 7.18 | 98861 | 104691 | -5.57 |
| V: | 10.81 | 4,875.58 | 4,455.19 | 9.44 | |
| $: | 10.81 | 765.65 | 705.35 | 8.55 | |
| PIPAVAV | Q: | 22.23 | 306181 | 232391 | 31.75 |
| V: | 10.81 | 4,876.20 | 4,217.45 | 15.62 | |
| $: | 10.74 | 760.84 | 629.56 | 20.85 | |
| KRISHNAPATNAM | Q: | 6.27 | 86420 | 62049 | 39.28 |
| V: | 10.58 | 4,773.83 | 3,701.63 | 28.97 | |
| $: | 10.59 | 749.65 | 557.87 | 34.38 | |
| J N P | Q: | 12.91 | 177752 | 149914 | 18.57 |
| V: | 10.42 | 4,699.10 | 4,084.96 | 15.03 | |
| $: | 10.45 | 740.10 | 615.93 | 20.16 | |
| TUTICORIN | Q: | 3.75 | 51684 | 42026 | 22.98 |
| V: | 5.89 | 2,654.96 | 2,220.52 | 19.56 | |
| $: | 5.89 | 417.09 | 334.77 | 24.59 | |
| CHENNAI | Q: | 3.52 | 48442 | 37305 | 29.85 |
| V: | 4.55 | 2,052.46 | 1,693.87 | 21.17 | |
| $: | 4.56 | 322.88 | 255.50 | 26.37 | |
| MANGALORE/ICD | Q: | 10.47 | 144235 | 126405 | 14.11 |
| V: | 3.98 | 1,793.41 | 1,584.08 | 13.21 | |
| $: | 3.98 | 281.54 | 278.45 | 1.11 | |
| OTHERS | Q: | 6.30 | 86,798.21 | 64,207.52 | 35.18 |
| V: | 4.73 | 2,133.84 | 1,757.96 | 21.38 | |
| $: | 4.73 | 335.01 | 265.01 | 26.41 | |
| Total | Q: | 100 | 1377244 | 1134949 | 21.35 |
| V: | 100 | 45,106.89 | 37,870.93 | 19.11 | |
| $: | 100 | 7,081.54 | 5,777.62 | 22.57 | |